|
|
Order by Related
- New Release
- Rate
Results in Title For flowcharting
 | RFFlow is the ideal program for creating a wide variety of flowcharts, organization charts, and diagrams for education, business, and industry. It's easy to draw and edit charts with RFFlow. Simply drag a shape from a stencil to your chart. Shapes in RFFlow will automatically size around your text. Right-click on a shape or line to edit its properties. RFFlow includes over 1600 shapes that are carefully organized into stencils designed for specific tasks. The stencils are arranged in an expandable list that allows you to quickly find the stencil or shape you want. Each shape has a tooltip displaying its name or description. RFFlow has stencils for audit objects, brackets, cause-effect (fishbone) diagrams, computer/network design, CPM charts, criminal investigation diagrams, data flow diagrams, database definitions, electrical/electronics, entity relationship diagrams, flowcharting (basic flowcharting, DIN66001, physical flowcharting), fluid power design, gantt charts, genetic pedigree charts, Graham process flow, Greek alphabet, IDEF0, IDEF1X, industrial objects, office layouts, organization charts, pert charts, quality system/ISO 9000 charts, SDL charts, software design (UML, Booch, Gane/Sarson, Shlaer-Mellor OOA,Yourdan, and others), structure charts, timelines, transportation objects and WBS charts. You can use the RFFlow stencils or create your own custom stencils with just the shapes and lines you need. You can import bitmaps and clip art pictures from files or from the Clipboard and add them to a custom stencil. You can also draw your own custom shapes in RFFlow and add them to a stencil. Text is entered and formatted just like it is in your word processor. RFFlow is an OLE server so you can easily copy and paste your charts into Word or other Windows applications. You can embed or link your chart. RFFlow allows you to save your charts in GIF, JPEG, and HTML formats for use on Web sites. Technical support is free and unlimited. .. |
|
Results in Keywords For flowcharting
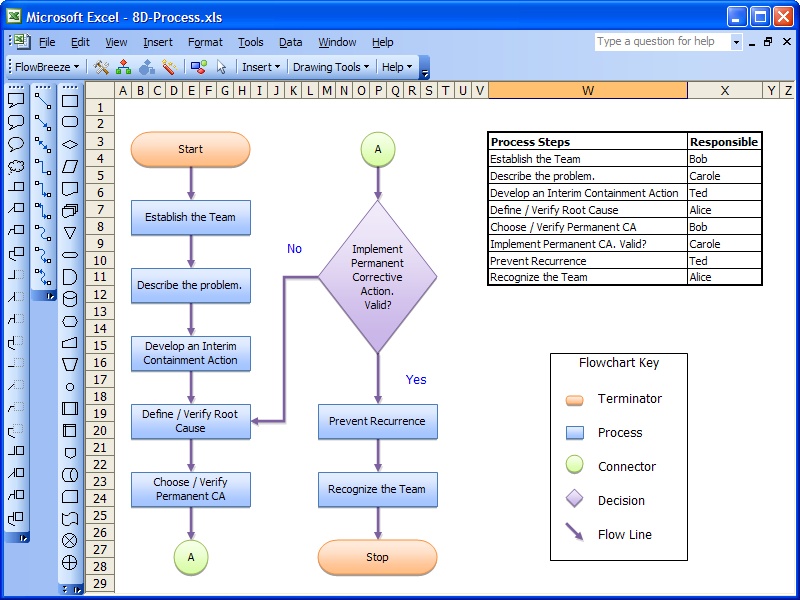 | FlowBreeze Flowcharting Software is a 100% MS Office integrated tool for making flow charts the fast, easy, and affordable way. FlowBreeze Flowchart Software lets you Just Type the Text. FlowBreeze Flow Chart Software converts the text into flowchart shapes, adds flow lines, and formats the drawing automatically. It lets you generate flowcharts in Excel, then easily copy and paste them into Word, PowerPoint, and other Microsoft applications as native Microsoft Drawing objects. With over 400 million Microsoft Office users worldwide, FlowBreeze is the perfect process flow mapping tool for collaboration with co-workers, customers, and vendors. FlowBreeze integrates with Excel, making it a wonderful analysis tool for true Process Mapping, letting you easily map cost and quality attributes to process steps on the same worksheet - the same functionality found in process mapping tools 5-10X the price of FlowBreeze. Whether you're a small company documenting your processes on the way to E-Myth mastery or a large company looking for an effective flowcharting solution, FlowBreeze can save you time and money. Unlike the $200-$300 drawing software packages, FlowBreeze is not designed to draw electrical schematics, plumbing diagrams, or other specialized drawings. Instead, FlowBreeze is designed to do one thing, and do it well: Draw Flow Charts. FlowBreeze users get a 2-3X time savings with the unique text-to-flowchart capability. Additionally, FlowBreeze has other time savings features like the ability to create a flowchart symbol key in one click, automatic flow chart shape sizing, and automatic flowchart connector routing. Lastly, a popular features of FlowBreeze Flowchart Software is the ability to create process flowcharts on the fly from existing work instructions, procedures, or other process documentation written in Word (or some other word processor) by simply copying all the existing text and pasting it into the FlowBreeze interactive flowcharting environment... |
|
| RFFlow is the ideal program for creating a wide variety of flowcharts, organization charts, and diagrams for education, business, and industry. It's easy to draw and edit charts with RFFlow. Simply drag a shape from a stencil to your chart. Shapes in RFFlow will automatically size around your text. Right-click on a shape or line to edit its properties. RFFlow includes over 1600 shapes that are carefully organized into stencils designed for specific tasks. The stencils are arranged in an expandable list that allows you to quickly find the stencil or shape you want. Each shape has a tooltip displaying its name or description. RFFlow has stencils for audit objects, brackets, cause-effect (fishbone) diagrams, computer/network design, CPM charts, criminal investigation diagrams, data flow diagrams, database definitions, electrical/electronics, entity relationship diagrams, flowcharting (basic flowcharting, DIN66001, physical flowcharting), fluid power design, gantt charts, genetic pedigree charts, Graham process flow, Greek alphabet, IDEF0, IDEF1X, industrial objects, office layouts, organization charts, pert charts, quality system/ISO 9000 charts, SDL charts, software design (UML, Booch, Gane/Sarson, Shlaer-Mellor OOA,Yourdan, and others), structure charts, timelines, transportation objects and WBS charts. You can use the RFFlow stencils or create your own custom stencils with just the shapes and lines you need. You can import bitmaps and clip art pictures from files or from the Clipboard and add them to a custom stencil. You can also draw your own custom shapes in RFFlow and add them to a stencil. Text is entered and formatted just like it is in your word processor. RFFlow is an OLE server so you can easily copy and paste your charts into Word or other Windows applications. You can embed or link your chart. RFFlow allows you to save your charts in GIF, JPEG, and HTML formats for use on Web sites. Technical support is free and unlimited...
|
|
Results in Description For flowcharting
| FlowBreeze Flowcharting Software is a 100% MS Office integrated tool for making flow charts the fast, easy, and affordable way. FlowBreeze Flowchart Software lets you Just Type the Text. FlowBreeze Flow Chart Software converts the text into flowchart shapes, adds flow lines, and formats the drawing automatically. It lets you generate flowcharts in Excel, then easily copy and paste them into Word, PowerPoint, and other Microsoft applications as native Microsoft Drawing objects. With over 400 million Microsoft Office users worldwide, FlowBreeze is the perfect process flow mapping tool for collaboration with co-workers, customers, and vendors. FlowBreeze integrates with Excel, making it a wonderful analysis tool for true Process Mapping, letting you easily map cost and quality attributes to process steps on the same worksheet - the same functionality found in process mapping tools 5-10X the price of FlowBreeze. Whether you're a small company documenting your processes on the way to E-Myth mastery or a large company looking for an effective flowcharting solution, FlowBreeze can save you time and money. Unlike the $200-$300 drawing software packages, FlowBreeze is not designed to draw electrical schematics, plumbing diagrams, or other specialized drawings. Instead, FlowBreeze is designed to do one thing, and do it well: Draw Flow Charts. FlowBreeze users get a 2-3X time savings with the unique text-to-flowchart capability. Additionally, FlowBreeze has other time savings features like the ability to create a flowchart symbol key in one click, automatic flow chart shape sizing, and automatic flowchart connector routing. Lastly, a popular features of FlowBreeze Flowchart Software is the ability to create process flowcharts on the fly from existing work instructions, procedures, or other process documentation written in Word (or some other word processor) by simply copying all the existing text and pasting it into the FlowBreeze interactive flowcharting environment... |
|
 | Code to Flow chart generator is an automatic flow chart generator software , It can reverse engineering a program , create programming flowchart from code, mostly used on flowcharting a program and documenting source code ...
|
|
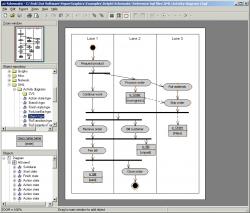
 | AgFlowchart is a excellent source code flowcharting tool to generate flowchart from source code. Its flowchart can expand and shrink. Move and zoom is also very easy. It can export the flowchart as a Microsoft Word file or a bitmap file. t can help programmers understand, document and visualize source code.
It supports C,C++,VC++(Visual C++ .NET),Delphi(Object Pascal).
Maybe it can help you!.. |
|
 | Visual Code Browser for C/C++ is a C/C++ Code Browser integrating program code editor,analyzer and documentation generator with code flowcharting and visualization.
It can help programmers to browse,edit,document and understand c,c++source code with built-in analysis for C/C++ program.It also can be used to visualize and flowchart c,c++ code.
Its flow chart Documentation Generator supports Visio,Word,Excel,PowerPoint and BMP.
It now supports C,C++,VC++(Visual C++ .NET) programming languages...
|
|
 | ConceptDraw V is designed for professional flowcharting, diagramming and illustrating. Its flexible, handy tools help business and technical users quickly document complex structures, systems and processes. ConceptDraw V charts can be shared as a variety of graphics files and CAD documents, printed pages, presentations and web pages. Owing to the advanced libraries of pre-drawn shapes, ConceptDraw V is perfect for most of the charting tasks. In this version of ConceptDraw -5.5.0 Converting ellipses from EMF to vector picture format is improved.
Copying library objects within the same library is added. Use drag & drop pressing Ctrl/Cmd key.
The tool became even more helpful and easy to use... |
|
 | Professional diagramming, flowcharting, tool that focuses on ease of learning and use. Create any type of block diagrams with shapes connected by arrows. Built-in shapes and arrow heads, plus create your own. Contains many features only found in very expensive packages such as full zoom, OLE connectivity, poster printing, graphics import and export. Creates diagrams by letting you 'stamp' any number of predefined shapes on your layout, add a wide variety of text styles, and connect the shapes with smart connecting lines that maintain relationships between shapes. The focus of this tool is on ease-of-use, speedy results, automation, and quality output. It contains a full set of high-end features as well like full pan and zoom, poster printing, linking diagrams into your documents, several kinds of curves, importing clip-art, and exporting web graphics. Powerful grid and alignment aids keep your diagram attractive and customizable styles and templates let you design your own diagram types...
|
|
 | Procedure Charter Professional Includes all the great features of Procedure Charter Standard and has additional functionality such as spellchecking, security and its own report designer.
Procedure Charter Professional has been designed for the everyday procedural or flowcharting needs of organizations. With Professional you can deploy the additional report designer so individuals can create customized reports/procedures. Alternatively design Standard reports and do not deploy report designer, so you can maintain consistency across your reports.
Easily meets ISO 9000 procedural requirements and other ISO Standard/regulatory requirements, with password protection and revision history. Combine Professional with Net Publisher to rapidly deploy procedures across the room, or across the world.
Typically Professional is deployed to any chart authors, with the report designer module in Professional being deployed to specific report designers.
Add additional information/database fields with Professional PLUS! To cover all your information needs.
To publish active HTML charts check out FlowBiz Net Publisher If you need a database solution with security and search with an on-line coach, check out Enterprise... |
|
 | ConceptDraw VI is designed for professional flowcharting, diagramming and illustrating. Its flexible, handy tools help business and technical users quickly document complex structures, systems and processes. ConceptDraw VI charts can be shared as a variety of graphics files and CAD documents, printed pages, presentations and web pages. Owing to the advanced libraries of pre-drawn shapes, ConceptDraw VI is perfect for most of the charting tasks. The tool became even more helpful and easy to use.
Key Features:
- Export to SVG
- MS Visio Support
- Spell Checker
- Powerful Drawing Tools
- Libraries of pre-drawn shapes: Building Plans, Business Diagrams, Organization Charts, Landscape and Garden Design, Industrial Equipment, Computers and Network, Maps, Science, ERD and Database, Project Management, Web and other
- Import and export to a large number of raster, vector, multimedia and text formats
- Cross-Platform Compatibility
- AutoCAD DXF files support
- Creation and editing of MS PowerPoint files
- PDF and HTML export
- Database Connectivity.. |
|
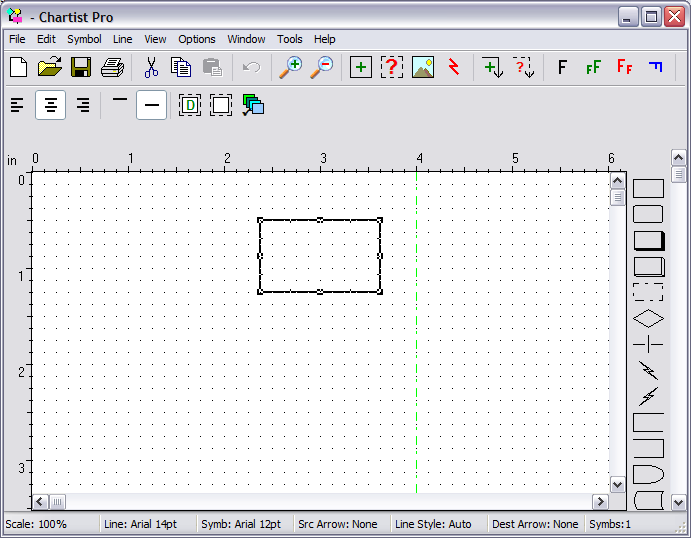 | Chartist is an interactive flowcharting application. With Chartist you can create, edit, and print flow charts, organization charts, or other charts that use similar components. Through the use of the Windows Clipboard, you may also paste all or part of the charts you create into other documents, providing the application can read Clipboard bitmaps or metafile pictures. Chartist supports the OLE feature of Windows, allowing other applications to link or embed Chartist information. Supports multiple documents. Data may be exchanged among Chartist documents, using the Clipboard or drag and drop. Chartist supports the text, graphics and color capabilities of your display and printer. Text in a Chartist document may use any number of the fonts available from your printer. A Chartist document is one or more pages in size. The orientation of pages depends upon the settings for your printer. Within a Chartist document there may as many as 4000 symbols. A symbol is a polygonal shape with optional text or graphics inside it. The text inside a symbol may be in any of the fonts available from your printer. Multiple fonts may be used for the text inside a symbol. Lines may be drawn between symbols. The lines are routed automatically, with influence from the user as to symbol entry and exit points. Lines may be drawn with or without arrowheads, in different thicknesses, with solid, dotted or dashed pen styles, and with three different routing styles (straight, curved, square turns). When symbols are moved around the document, any associated lines are rerouted and redrawn as necessary. Lines may also be labeled with text... |
|
 | Polar Draw Component is a complete draw solution that comes with an arsenal of powerful drawing features enabling you to build Visio-style charts from within your application. Also allows you to create flow charts, vector drawings, raster images and more with the ability to include hyperlinks and various shading and coloring effects. You can group objects together, include images and text, link them together and apply custom drawing effects to create charts similar to Microsoft Visio, Adobe Illustrator, and CorelDRAW. Many C++ and VB sample projects with complete source code are included in this offer. Full source code written in MS Visual C++ offers you unlimited freedom in customizing your ideal solution. You get the complete control of the product's programming quality at no extra cost!
Features
- Powerful flowcharting tool
- Vector drawing
- Simple and easy hyperlinking
- Raster imaging tools
- Variety of text editing options
- Logical and intuitive object model
- Database connections (Binary Large Object - BLOB)
- Variety of properties to set your workspace display
- Single absolute coordinate system
- Useful printing options
Polar Draw Component is compatible with a wide range of development languages and platforms, including:
- MS Visual Visual Studio
- MS FoxPro for Windows
- MS Active Server Pages
- All Borland Developer Studio evironments
- Any other 32-bit programming environments that support DLL/COM and .NET components
Polar Draw Component is intuitive to use, yet rich with advanced functionality. You will definitely benefit from royalty-free distribution rights and source code that gives you ability to further develop the product to your specific needs. Fully functional trial version is also available so you can evalute the product before purchasing. You will find such an extra value with no other component on the market!.. |
|
Results in Tags For flowcharting
| RFFlow is the ideal program for creating a wide variety of flowcharts, organization charts, and diagrams for education, business, and industry. It's easy to draw and edit charts with RFFlow. Simply drag a shape from a stencil to your chart. Shapes in RFFlow will automatically size around your text. Right-click on a shape or line to edit its properties. RFFlow includes over 1600 shapes that are carefully organized into stencils designed for specific tasks. The stencils are arranged in an expandable list that allows you to quickly find the stencil or shape you want. Each shape has a tooltip displaying its name or description. RFFlow has stencils for audit objects, brackets, cause-effect (fishbone) diagrams, computer/network design, CPM charts, criminal investigation diagrams, data flow diagrams, database definitions, electrical/electronics, entity relationship diagrams, flowcharting (basic flowcharting, DIN66001, physical flowcharting), fluid power design, gantt charts, genetic pedigree charts, Graham process flow, Greek alphabet, IDEF0, IDEF1X, industrial objects, office layouts, organization charts, pert charts, quality system/ISO 9000 charts, SDL charts, software design (UML, Booch, Gane/Sarson, Shlaer-Mellor OOA,Yourdan, and others), structure charts, timelines, transportation objects and WBS charts. You can use the RFFlow stencils or create your own custom stencils with just the shapes and lines you need. You can import bitmaps and clip art pictures from files or from the Clipboard and add them to a custom stencil. You can also draw your own custom shapes in RFFlow and add them to a stencil. Text is entered and formatted just like it is in your word processor. RFFlow is an OLE server so you can easily copy and paste your charts into Word or other Windows applications. You can embed or link your chart. RFFlow allows you to save your charts in GIF, JPEG, and HTML formats for use on Web sites. Technical support is free and unlimited... |
|
 | Create flowcharts and similar diagrams. Drawing boxes or symbols of many shapes and connect them with lines of various types. With full zoom, OLE, graphics import and export, curves, flow symbols...
|
|
 | Create flowcharts, network diagrams, design diagrams, and all other block diagram types. Drawing boxes or symbols of many shapes and connect them with lines of various types. Full zoom, OLE, graphics import and export, curves, flow symbols... |
|
 | Schematic is a diagramming tool that allows you to combine text, pictures, shapes and connectors to create clear and informative diagrams. Schematic has a clean and easy to use GUI, including a tree-view for easy object navigation, an object preview window and a zoom/pan window. Schematic also features full undo/redo functionality.
One of Schematic's powerful drawing features is the way that connectors and sockets work. Connectors allow visual connections to be made between graphical objects. These connections are both visual and logical, meaning that when graphical objects are moved any connector objects attached to them are automatically adjusted to maintain the connection. Connectors will snap to object perimeters or any existing socket objects which define specific snap locations. A variety of different connectors are available including Bezier, right-angled and forked connectors.
All objects can be snapped to specific locations on the page. The snap location spacing can easily be adjusted.
Schematic comes with a variety arrow types including pointed, diamond and circular. Arrows can be situated at end-points and at specific locations along a line or connector.
Schematic comes supplied with a rich collection of specialist objects known as widgets. These can be accessed via the object repository and exist in a hierarchy so that they can be located easily. Schematic comes supplied with many specialised graphical libaries including UML, electrical, network, flowchart, DFD and ERD libraries.
Users can easily create there own widgets for later inclusion in diagrams. A widget can simply be an existing object that has been customised by having some of its properties changed or be an existing drawing object with other drawing objects attached to it as children. The supplied sets of widget files were all created as user-defined widgets using Schematic.
Schematic includes print preview support and the export of diagrams as EMF, PNG and JPG files...
|
|
 | EDraw Flowchart ActiveX Control - Build flowchart applications with minimum time loss! Lets you quickly build basic flowcharts, organizational charts, business charts, hr diagram, work flow, programming flowchart and network design diagrams... |
|
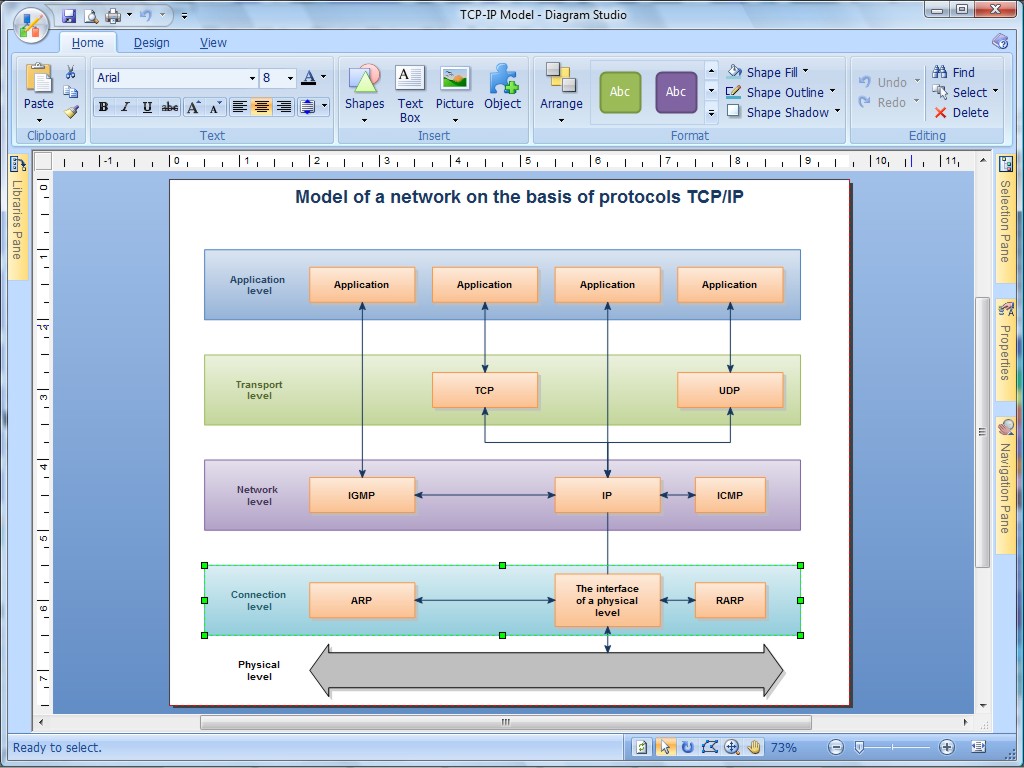 | Diagram Studio is a tool for creating flowcharts, business and technical diagrams. Draw objects, various shapes and link them together. The program features user-controlled points of connection, color shadows, graphics import and export, curves...
|
|
 | Schematic is a diagramming tool that allows complex diagrams to be drawn with ease. Schematic allows you to combine text, pictures, shapes and connectors to create clear and informative diagrams. UML, Electrical, Network, DFD, ERD plus many more..... |
|
| Visual Code Browser for C/C++ is a C/C++ Code Browser integrating program code editor,analyzer and documentation generator with code flowcharting and visualization.
It can help programmers to browse,edit,document and understand c,c++source code with built-in analysis for C/C++ program.It also can be used to visualize and flowchart c,c++ code.
Its flow chart Documentation Generator supports Visio,Word,Excel,PowerPoint and BMP.
It now supports C,C++,VC++(Visual C++ .NET) programming languages... |
|
| Flipper CAD Control is an easy way to add dramatic two-dimensional graphics and flowcharting to applications. You'll have unique ways to organize, present, and show off complex information in an appealing format. An ActiveX component, the control can be used in virtually any development environment that supports this technology.
Customization and Power:
- Flowcharting and sticky points
- Numerous shape types
- Text and font control
- Grouping and layering
- Color and pattern control
- DXF support
- Zooming and scrolling
Ease of Use:
- Intuitive design
- Programmatic and run-time drawing
- Tutorial and searchable help file
- Numerous examples
Great Value:
- Royalty free run-time distribution
- Free updates
- Free online technical support.. |
|
| Code Visual to Flowchart is an automatic flow chart generator software , It can reverse engineering a program , create programming flowchart from code,mostly used on flowcharting a program and documenting source code ,support Visio, Word, Excel.. |
|
Related search : ,activex controlflowchart activex,flowchart activex controldiagram work flowchartwork flowchart programmingflowchart programming flowchartcharts business chartsorganizational charts businessbasic flowcharts organizationalflowcharts organizational chaOrder by Related
- New Release
- Rate
|
|