|
|
Order by Related
- New Release
- Rate
Results in Title For line graph
 | This PHP script provides a very easy way to embed dynamically generated line graphs and charts into PHP applications and HTML web pages. The graphing software is very easy to use and it's perfectly possible to add professional quality real time graphing to web pages and applications within minutes. With a free trial and Money Back Guarantee, try it out today. .. |
|
 | The 2D / 3D Line Graph provides a client and server side solution for the incorporation of line graphs & charts into web pages. Versatile components so web authors and Java developers can easily build and publish dynamic and interactive line charts. ..
|
|
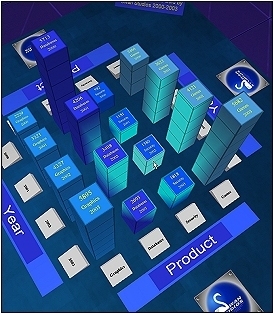
 | This applet is designed to take multiple series of numerical data and display the information as a 3D Multi series Line Graph. The applet will automatically size itself to the available area given to it by the HTML form. (The WIDTH and HEIGHT of the APPLET tag.)
The applet is easy to use and highly configurable and contains the following features,
General Features
3D Mode
Chart Grids On/Off Color Selectable
Chart Axis On/Off Color Selectable
Outlines On/Off Color Selectable
Labels On/Off Font and Color Selectable
Configurable Scale
Chart Starting Values
Number of Rows and Columns
Number of Series
Configurable Grid Starting x,y position
Configurable Number of decimal places to show values
Label Orientation
Configurable Depth of the 3D effect
Display Values on Mouse Over events
URL link on Mouse Click Events
Upto 10 Free Form Images can be incorporated into the Chart Canvas
Upto 10 Free Form Lines of Text can be incorporated into the Chart Canvas .. |
|
 | 2D / 3D Line Graph provides both a client and server side solution for the incorporation of line graphs into web pages. It provides versatile components so that web authors and Java developers can easily build and publish dynamic and interactive line graphs. With many configurable features and functions to both applet and servlet, the documentation and examples are designed to give both a full understanding of every feature and enable you to implement both the applet and servlet quickly and easily. With a free trial and Money Back Guarantee, try it out today. Professional License This license caters for the following purposes, i) For developers and designers who make web applications or multiple websites, for multiple organization or people. ii) For placing on a CD ROM where the product forms part of a package to be installed. iii) For placing on multiple issues of CD ROMs iv) For the incorporation of the product into a larger application which is subsequently sold / distributed. ..
|
|
 | 2D / 3D Line Graph provides both a client and server side solution for the incorporation of line graphs into web pages. It provides versatile components so that web authors and Java developers can easily build and publish dynamic and interactive line graphs. With many configurable features and functions to both applet and servlet, the documentation and examples are designed to give both a full understanding of every feature and enable you to implement both the applet and servlet quickly and easily. With a free trial and Money Back guarantee, try it out today. Professional License This license caters for the following purposes, i) For developers and designers who make web applications or multiple websites, for multiple organization or people. ii) For placing on a CD ROM where the product forms part of a package to be installed. iii) For placing on multiple issues of CD ROMs iv) For the incorporation of the product into a larger application which is subsequently sold / distributed. .. |
|
 | 2D / 3D Line Graph provides both a client and server side solution for the incorporation of line graphs into web pages. It provides versatile components so that web authors and Java developers can easily build and publish dynamic and interactive line graphs. With many configurable features and functions to both applet and servlet, the documentation and examples are designed to give both a full understanding of every feature and enable you to implement both the applet and servlet quickly and easily. With a free trial and Money Back Guarantee, try it out today. Standard License This license caters for the following purposes, i) Any number of web sites / pages belonging to a single organization or individual. ii) Any number of intranet sites / pages belonging to a single organization or individual. iii) Placing upon a CD where the product is used for the navigation of that CD, regardless of how many copies of that CD are distributed. (e.g. 6000 CD-ROM's with the same thing on each CD-ROM). ..
|
|
 | Insta-Graph is an add-in for Microsoft Excel that will revolutionize the way you create and use graphs (aka charts) in Excel. Anyone who has to analyze information, identify trends, prepare budgets, forecasts, or look at any other information in Excel where graphing is helpful will benefit from Insta-Graph. Insta-Graph overcomes major weaknesses of the built in charting tool that ships with Excel. You can graph cell values automatically and instantly simply by selecting a range in Excel. As you select, unselect, or change cells the graph changes instantly to reflect your selection. You can predefine an unlimited number of formats and layouts for your graphs and save them as themes in Insta-Graph. Whenever you open an Insta-Graph window the theme you used last is automatically applied. Insta-Graph offers a more organized layout of the available graph options. You can add the graph into your Excel workbook. Insta-Graph has numerous other features built in that improve on Excel charting. .. |
|
| Free Daily Thoroughbred Handicapping Graphs available for all tracks running.. Designed using a 2 million-line database. A7 is simplest, fastest software ever created. A single click prints the graphs an entire card. No charge. Nothing to buy. FREE expert analysis available everyday. Even children can pick winners using this FREE software. From the 15 year leader in thoroughbred handicapping. .. |
|
| Flipper Graph Control enables you to communicate easier and faster by integrating customized charts into your application. Just follow a few simple steps and, your data is transformed into colorful, easy-to-understand visuals. You get many advanced tools and tricks not available with spreadsheets, including drill down, user interaction and more. As an ActiveX component, Flipper Graph Control can be used in virtually any development environment supporting this technology.
Ease of Use:
- Intuitive design based on 15 years of experience
- Tutorial and searchable help file
- Numerous examples
- Date/Time data support
- Data connectivity
Customization and Flexibility:
- Multiple graph types and combinations
- Absolute scale control
- Tooltips and drilldown
- Runtime menus
- Mouse interaction and data dragging
- Zooming and scrolling
- Image importing
Great Value:
- Royalty free run-time distribution
- Award winning architecture
- Free updates
- Free online technical support .. |
|
| Flipper Graph ASP communicates your data to clients, investors and web users with dramatic, eye-catching graphs. A server side component, Flipper Graph ASP is truly cross platform and cross browser. Simply export your graphs to GIF, transparent GIF, or PNG format and display it on a web page. Graph images can be saved to disk or streamed out directly to the browser. Add impact with tooltips and the ability to drill down with imagemap clicks.
Customization and Flexibility:
- Multiple graph types and combinations
- Absolute scale control
- Tooltips and drilldown
- Mouse interaction and image-mapping
- Image importing
Ease of Use:
- Intuitive design based on 15 years of experience
- Tutorial and searchable help file
- Numerous examples
- Date/Time data support
- Data connectivity
Stability and Performance:
- Award winning architecture
- Image caching
- Binary image streaming
- Superior time to last byte and requests per second
- Free online technical support .. |
|
Results in Keywords For line graph
| An equation grapher. Built-in project manager for drawing multiple graphs. Calculate and display integrals. Calculate curve angles. Find X-values from Y values. Built-in calculator.Save as BMP, WMF or copy to clipboard as BMP Graph and environment information. Set up colors, line thickness, grid, grid spacing, numbers on grid, number of decimals shown.Graph resolution 50-5000 points. Remember position, size and grid size. On-line .. |
|
 | 2D / 3D Area Graph provides both a client and server side solution for the incorporation of line graphs into web pages. Versatile components enable web authors and Java developers to easily build and publish dynamic and interactive area graphs...
|
|
| The 2D / 3D Line Graph provides a client and server side solution for the incorporation of line graphs & charts into web pages. Versatile components so web authors and Java developers can easily build and publish dynamic and interactive line charts... |
|
 | Fly-through 3D graph software for exciting presentations, marketing, sales, analysis and fun!..
|
|
 | 2D / 3D Vertical Bar Graph provides both a client and server side solution for the incorporation of bar graphs into web pages. Versatile components enable web authors and Java developers to easily build and publish dynamic bar graphs.. |
|
 | Easy to use, intuitive program to visualize and study functions of one variable to find roots, maxima and minima, integral, derivatives, graph. Results, including the graph, can be saved or printed. You can also copy the graph to the clipboard, which you can then paste where you please (Word, Paint, etc.). You have one-click control of the graph with zooming, panning, centering, etc. Includes a help file with instructions, example and methodology..
|
|
| An equation graphing program that can display Functional, Polar and Parametric Equations. The main features of Graph Viewer 2D are: Functional, Polar and Parametric graphs.A Maximum of 10 equations can be defined for each graphtype. User defined variables and constants. User configurable display. Saving as bitmap or metafile. Trace a graph. Printing of graphs. Copying to the .. |
|
 | 2D / 3D Horizontal Bar Graph provides both a client and server side solution for the incorporation of bar graphs into web pages. Versatile components enable web authors and Java developers to easily build and publish dynamic and interactive bar graph.. |
|
 | 3D Vertical Bar Graph provides both a client and server side solution for the incorporation of bar graphs into web pages. Versatile components enable web authors and Java developers to easily build and publish dynamic bar graphs.. |
|
 | The Vertical Bar Graph API is a Java Bean Component. Designed specifically to enable programmers to easily add powerful graphing functionality to any form of Java application. Download the Free Trial Now.. |
|
Results in Description For line graph
| MoNooN Grapher help that you plot the Mathematical Function Graphs. It can plot and display the following graphs. 2D Rectangular Coordinates Graph 2D Polar Coordinates Graph 3D Rectangular Coordinates Graph 3D Spherical Coordinates Graph 3D Cylindrical Coordinates Graph It includes Grapher 2DR, Grapher 2DP, Grapher 3DR, Grapher 3DS, and Grapher 3DC. .. |
|
 | Calculates the Rate of Return and Net Gain for your portfolio (investment, real estate, rental, etc.) Any time intervals, positive/negative RoR, regular contribution programs, individual transactions, combined (overall) portfolios, verification window for line-by-line review, graph, report, online help...
|
|
 | Create your own custom sheets of graph paper. You have complete control over the graph characteristics... |
|
 | AdSenseDesktop is the only flexible and fast analysis tool for Google AdSense users. It is very easy to use, while providing a wide range of ways to analyse your AdSense statistics. It allow AdSense user to download and analyse data very quickly and intuitively in graphical form.
AdSenseDesktop allow you to filter through all the data in matter of seconds. The data are displayed in tabulated form and you can sort any column for easy viewing. You can the data filter by:
- Range of date
- Group by daily, weekly, monthly, yearly
- Sort by date, channels, page impressions, clicks, clickthrough rate, effective CPM and earnings
- Filter by channels
Versatile graph generator
AdSenseDesktop has powerful graph generator to view data in a visual manner. This allow you to analyse for patterns and trends. We provide line graph, bar graph and area graph. AdsenseDesktop can generate any of the following graphs:
- Page Impressions graph
- No. Clicks graph
- Clickthrough rate graph
- Effective CPM graph
- Earnings graph
The best part is the data to generate the graphs can be filtered as mentioned in the previous feature.
Export data and graph
You can now easily export the data and graph you generated to html, cvs and graphical format. This allows you to to archive them for future review.
Printing of data and graph
You could also print out the data and graph you have generated with just a simple click. It will auto span to multi pages and add your header if you wish to add a personal touch.
Historical note keeping
The note keeping feature allow you to store short notes to track the changes made. This is a very useful feature for you to keep a history of the changes you made to your AdSense usage and how has that effected your earnings and performance
Quick access tray tool
AdSenseDesktop's tray tool resides in the Windows tray area on your task bar, providing you with quick access to commonly used features and also latest information from AdSense..
|
|
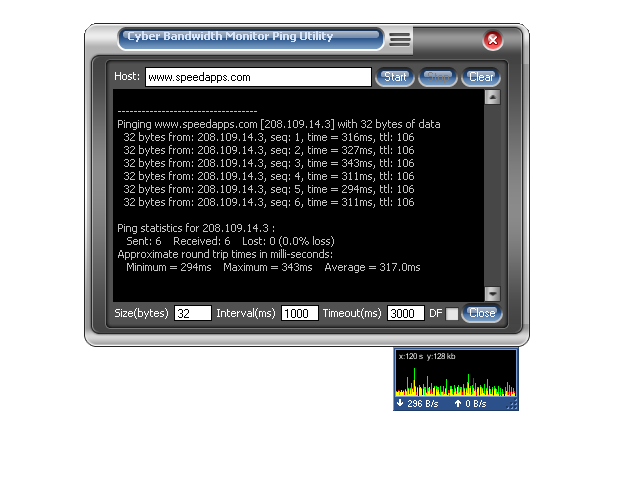 | Cyber bandwidth monitor helps keeping a close eye on the comings and goings of your bits and bytes. A graphing tool that shows your PC's upload and download activities in real time. Additionally Cyber Bandwidth Monitor bundles in some useful networking tools, like ping, traceroute, and IMAP and POP email notifiers. The graphs are highly configurable, show upload and/or download traffic, and can monitor any and all network interfaces.
Key Features:
- Graph of bandwidth usage, show download only, upload only, or both.
- Iconified Graph of bandwidth usage in Systray allows hiding of main graph when it is an obstruction.
- Display units in bits or bytes or both.
- Configurable connection speed (graph scale) and update interval.
- Monitor any or all network interfaces installed in your computer.
- Select colors and transparency of the graph.
- Log total bytes, time, and averages to an html or text file.
- View graph of last 24 hours stats.
- URL grabber watches clipboard for URLs, removes line breaks and opens them in your browser.
- Email notifier can check up to 5 POP/IMAP email accounts for new messages periodically.
- Graphic Ping and Traceroute utilities to help diagnose network problems.
- UPnP NAT utility for those who have compatible Internet Gateway Device detected in Windows Networking... |
|
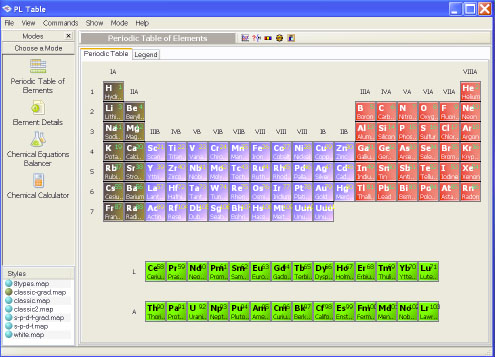 | This Periodic Table is an excellent tool for both students and serious researchers. It includes over 20 types of data on each element, most of which can be corelated in a particle or line graph. It even has a powerful chemical equation balancer..
|
|
| Checks is a tool to print graph papers, including table, millimeter, semilog, dots matrix, calender, etc. If you have a laser or inkjet printer, you can print graph papers of a very high quality, so, you don't have to buy a whole pack when you need only three pieces of them... |
|
 | Easy to use .NET gauge and charting controls for Windows Forms applications. The package includes Graph, Line, Area, Bar, Radar and Pie charts and Oval and Linear gauges. Each of them can be fully customized via the hundreds properties and methods... |
|
 | Easy to use .NET gauge and charting controls for Windows Forms applications. The package includes Graph, Line, Area, Bar, Radar and Pie charts and Oval and Linear gauges. Each of them can be fully customized via the hundreds properties and methods... |
|
 | Rt-Tools2D is a selection of components to generate two dimensional Cartesian plots: *TRtCaptionEdit: This is a special edit control supporting enhanced styles as bold, italic, underline, strikeout, subscript, superscript and symbol font. This is especially interesting to alter TRtLabels which supports the same styles. *TRtLabel: Label supporting enhanced styles as bold, italic, underline, strikeout, subscript, superscript and symbol font. It can be drawn in any angle. *TRtGraph: The main component of a 2D-plot. Just place on a form and the plot will be drawn automatically. Supports unlimited number of line series, unlimited number of axis in any position, auto zooming, grids ... *TRtAxis: The axis of the 2D-Graph. You can add as many of them to the graph as you like to any position: top, bottom, left or right. You can alter fonts, scaling, tick marks ... *TRtRealVector, TRtLiveVector: The components to store the numerical data. The data added to the LiveVector will automatically update also the ranges of the connected Series, which will update the axis ranges. You can place as many Vector components as you like to a form and connect also to different series. You can add a unlimited amount of real data to each vector as to a dynamic array or a list which automatically adjusts its size. *TRtLineSeries, TRtDataSeries, TRtDataWithErrorSeries: These components represent the lines of the 2D-Graph. You can place a unlimited number of Series to the form and connect to the 2D-Graph. The X-and Y-data can connect to any data vector as described above. The data can also be assigned any Axis available with the graph. *TRtLinerRegressionLine, TRtPolynomLine, TRtFittedLine, TRtInterpolatedLine, TRtDifferential, TRtIntegral: Calculated Lines updating automatically. *TRtLegend: Place this component to a form or inside the 2D-Graph and connect to the graph. It will automatically display a legend including the settings of the Series and their captions... |
|
Results in Tags For line graph
 | Add Powerful reporting features to your Web / Intranet pages and applications. With the advanced graphing package you will be quickly adding impressive dynamic charting capabilities bringing your data alive !.. |
|
| This applet is designed to take multiple series of numerical data and display the information as a 3D Multi series Line Graph. The applet will automatically size itself to the available area given to it by the HTML form. (The WIDTH and HEIGHT of the APPLET tag.)
The applet is easy to use and highly configurable and contains the following features,
General Features
3D Mode
Chart Grids On/Off Color Selectable
Chart Axis On/Off Color Selectable
Outlines On/Off Color Selectable
Labels On/Off Font and Color Selectable
Configurable Scale
Chart Starting Values
Number of Rows and Columns
Number of Series
Configurable Grid Starting x,y position
Configurable Number of decimal places to show values
Label Orientation
Configurable Depth of the 3D effect
Display Values on Mouse Over events
URL link on Mouse Click Events
Upto 10 Free Form Images can be incorporated into the Chart Canvas
Upto 10 Free Form Lines of Text can be incorporated into the Chart Canvas..
|
|
| The 2D / 3D Line Graph provides a client and server side solution for the incorporation of line graphs & charts into web pages. Versatile components so web authors and Java developers can easily build and publish dynamic and interactive line charts... |
|
| 2D / 3D Line Graph provides both a client and server side solution for the incorporation of line graphs into web pages. It provides versatile components so that web authors and Java developers can easily build and publish dynamic and interactive line graphs. With many configurable features and functions to both applet and servlet, the documentation and examples are designed to give both a full understanding of every feature and enable you to implement both the applet and servlet quickly and easily. With a free trial and Money Back Guarantee, try it out today. Professional License This license caters for the following purposes, i) For developers and designers who make web applications or multiple websites, for multiple organization or people. ii) For placing on a CD ROM where the product forms part of a package to be installed. iii) For placing on multiple issues of CD ROMs iv) For the incorporation of the product into a larger application which is subsequently sold / distributed...
|
|
| 2D / 3D Line Graph provides both a client and server side solution for the incorporation of line graphs into web pages. It provides versatile components so that web authors and Java developers can easily build and publish dynamic and interactive line graphs. With many configurable features and functions to both applet and servlet, the documentation and examples are designed to give both a full understanding of every feature and enable you to implement both the applet and servlet quickly and easily. With a free trial and Money Back guarantee, try it out today. Professional License This license caters for the following purposes, i) For developers and designers who make web applications or multiple websites, for multiple organization or people. ii) For placing on a CD ROM where the product forms part of a package to be installed. iii) For placing on multiple issues of CD ROMs iv) For the incorporation of the product into a larger application which is subsequently sold / distributed... |
|
 | Chart java application software to generate dynamic charts and graphs within JSP, servlets or java applications - bar, line, pie, stacked and grouped charts in 2D and 3D with a wide range of parameters and chart types...
|
|
 | Chart java application software to generate dynamic charts and graphs within JSP, servlets or java applications - bar, line, pie, stacked and grouped charts in 2D and 3D with a wide range of parameters and chart types... |
|
 | Chart java applet software to generate dynamic charts and graphs - bar, line, pie, stacked and grouped charts in 2D and 3D with a wide range of parameters and chart types... |
|
 | Chart java applet software to generate dynamic charts and graphs - bar, line, pie, stacked and grouped charts in 2D and 3D with a wide range of parameters and chart types... |
|
| 2D / 3D Line Graph provides both a client and server side solution for the incorporation of line graphs into web pages. It provides versatile components so that web authors and Java developers can easily build and publish dynamic and interactive line graphs. With many configurable features and functions to both applet and servlet, the documentation and examples are designed to give both a full understanding of every feature and enable you to implement both the applet and servlet quickly and easily. With a free trial and Money Back Guarantee, try it out today. Standard License This license caters for the following purposes, i) Any number of web sites / pages belonging to a single organization or individual. ii) Any number of intranet sites / pages belonging to a single organization or individual. iii) Placing upon a CD where the product is used for the navigation of that CD, regardless of how many copies of that CD are distributed. (e.g. 6000 CD-ROM's with the same thing on each CD-ROM)... |
|
Related search : olor selectableline graphseries linemulti series,series line graphmulti series lineline graph,line graph softwareline graph,graph software appletline graph softwareline graph,pro license softwaregraph software servletline graph softwarebar graphstockOrder by Related
- New Release
- Rate
graph 1 -
graph.c .com -
graph it -
graph -
graph.h .com -
|
|